

Nicole Boegeman
Excel can be a snow business growth tool, helping you identify inefficiencies, understand costs, improve billing and uncover opportunities
After a major snowstorm, how long does it take your company to know what actually happened?
Who was on each property? How many hours should be billed? How much salt was used? How much do you owe your subcontractors? Which properties made money, and which ones didn't?
If the answer is "too long," or worse, "I'm still not sure," the problem may not be a lack of data. It may be the way that data is gathered and organized.
In our presentation at the Snow & Ice Symposium in June, Ken Boegeman and I wanted to give attendees practical Excel skills they could take home and use immediately. At its core, however, the class was about structuring information so you can manage your snow business more effectively and make better decisions as you grow.
You can't improve what you can't measure
Snow contractors generate an enormous amount of information during a storm. Operators, properties, service times, hours worked, materials used, service types, billing, subcontractor costs and more all become part of the service record.
If your information is scattered across paper logs, emails, notes, text messages or poorly structured spreadsheets, answering a simple question can require hours of reconstruction. When you can't quickly determine what happened, you lose more than time.
You may miss a billing opportunity. You may overpay for labor. You may fail to identify an inefficient route or crew. You may not know which properties are profitable. If a customer disputes whether a service occurred, you may not have the documentation to support your position.
As we pointed out during the class, you can't improve what you can't measure, and you can't bill accurately for what you can't document.
Good records also give you something valuable: information you can use to make better decisions.
Excel is more than a spreadsheet
Snow management software is incredibly valuable for tracking operational information, including time-stamped visits, costs, revenue and material usage. Excel can help you organize and analyze that information so you can answer the questions that matter to your business.
Before learning what Excel can do, it helps to understand how to structure your data. Throughout our class, we used work orders from a fictional snowstorm as our example. Each row represented one person performing one service at one property. Each column contained a specific piece of information about that work order, such as the operator, property, service type, hours worked or billing amount. Those basic habits of structuring data make everything else in Excel work better.
Put your data to work
Once your data is structured correctly, you can start putting Excel to work. During the class, we demonstrated several practical tools we call Quick Wins:
- One was Freeze Panes, a simple feature that keeps your column headers (or other important information) visible as you scroll through a large spreadsheet.
- Another was saving a blank copy of your finished spreadsheet as a template. Keeping the headings, formatting, and structure saves time and helps keep your data consistent from one use to the next.
- The other wins we discussed included multi-level sorting and adding numbers quickly.
The best way to become more comfortable with Excel is to use it. If you get stuck, use Excel's Help feature, search YouTube for video tutorials or even have your favorite AI walk you through most questions.
Build with the end in mind
Ultimately, everything we covered in the class came back to one question: What do you want your data to tell you?
Do you want to know which properties are profitable? How many hours your crews worked? How much salt you used? What you owe your subcontractors?
Start with the questions you want to answer, then determine what information you need to answer them. That changes the way you build your spreadsheet. Instead of collecting information because you think you might need it someday, you create a structure around the decisions you need to make.
That's where Excel becomes a business-growth tool, helping you identify inefficiencies, understand costs, improve billing and uncover opportunities you might otherwise miss.
You don't have to become an Excel expert overnight. Start with one process. Structure the data correctly. Learn a few basic tools. Then build from there.
The goal is to make your data work for you because you can't improve what you can't measure, and you can't grow what you can't see.
Four common spreadsheet mistakes
Even with the right structure, a few simple habits can make a spreadsheet harder to use:
- Merged cells may make a spreadsheet look cleaner, but they can create problems when you try to sort, filter, or subtotal your data. Avoid them until you're ready to print or present the final version.
- Blank rows may visually separate details, but that separation disappears when the data is sorted. Use formatting, such as borders, instead.
- Titles belong in the document header, not in the data. This is a bonus tip we didn't cover in our Symposium class. Row 1 should contain your column headings, not a title.
- Always keep a clean copy. Before working with raw data, duplicate the worksheet and leave one version untouched. If something goes wrong, you always have a clean starting point.
Four mindsets that make your data more useful
1. Consistency is everything. Decide what you are going to call something before you start entering data and then use that terminology every time. If a parking lot clear service is labeled by some in your company as "Lot Clear," by others as "Plow Lots" and even once as "Parking Lot Clear," Excel sees three things. It doesn't understand that they are all the same service, so it won't group them together when you sort. Create a standard list of names, service types, properties or other categories for your company, and share it with everyone who works with the spreadsheet so they know what terms to use.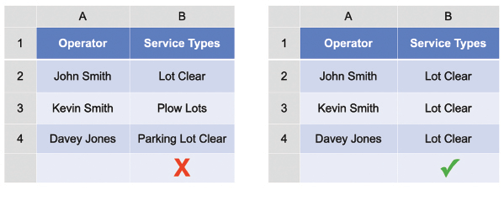
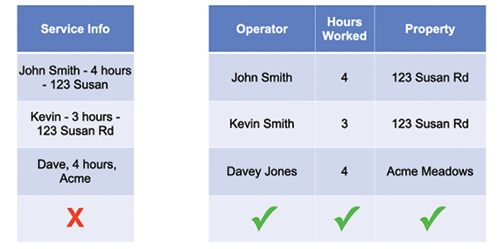
2. Put one thing in each cell. You might know that John Smith worked four hours at 123 Susan Road. It can be tempting to put all of that information into one cell. If you later want to know how many hours John Smith worked, or how many hours were spent at 123 Susan Road, Excel can't easily answer that question if all of the information is buried in a single note. Put the operator in one column, hours worked in another and property name in another. Each column should answer a question you might want to ask later. If you might someday want to add up numbers, sort by person or filter by property, the information deserves its own column.
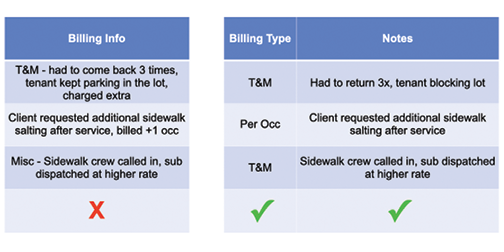
3. Notes are not data. Notes have a place in a spreadsheet, but they shouldn't replace structured information. For example, "T&M – had to come back three times because tenant kept parking in the lot" contains useful information. But if you want to know how many T&M jobs you performed, Excel can't efficiently sort that information if "T&M" is buried inside a sentence. Instead, use a dedicated Billing Type column for the consistent category and a separate Notes column for the explanation.
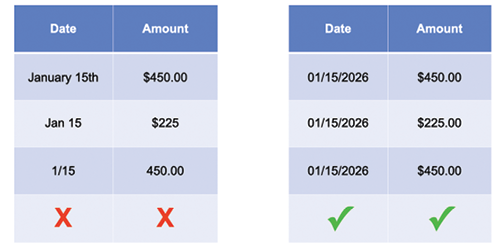
4. Format your columns correctly. Excel needs to understand the type of information in each cell. Dates should be formatted as dates, dollar amounts as currency and numbers as numbers. Without proper formatting, your data may not behave the way you expect. Dates may not sort chronologically, and numbers stored as text may not calculate correctly. A spreadsheet can look perfectly fine on the screen while giving you problems when you try to use the information.
Resource: We created a webpage with step-by-step instructions, videos and a practice file to download. Visit sgadvantage.com/excel to check it out.
Nicole Boegeman is executive vice president of Swinter Group and SG Advantage. Contact her at nicoleb@swintergroup.com.
Related Articles

Map out processes and ID shortfalls before buying software
Business
Map processes to help choose the right tech

Thriving amid change
Business
How snow and ice leaders can use uncertainty to build stronger operations

Veil protection
Risk Management
Keep personal assets separate and operate under the correct company name.